Dataflow
The dataflow is a tool to quickly visualize all your data processing steps and data sources in a single chart.
Objects edition
In Serenytics, Automations and Datasources are edited in their dedicated configuration pages. From the dataflow, if you click on an object, you will be redirected to its page. And from the configuration page of a datasource, you can display the dataflow section used to build this datasource. This helps you to navigate very quickly among your data flow components.
Datasources
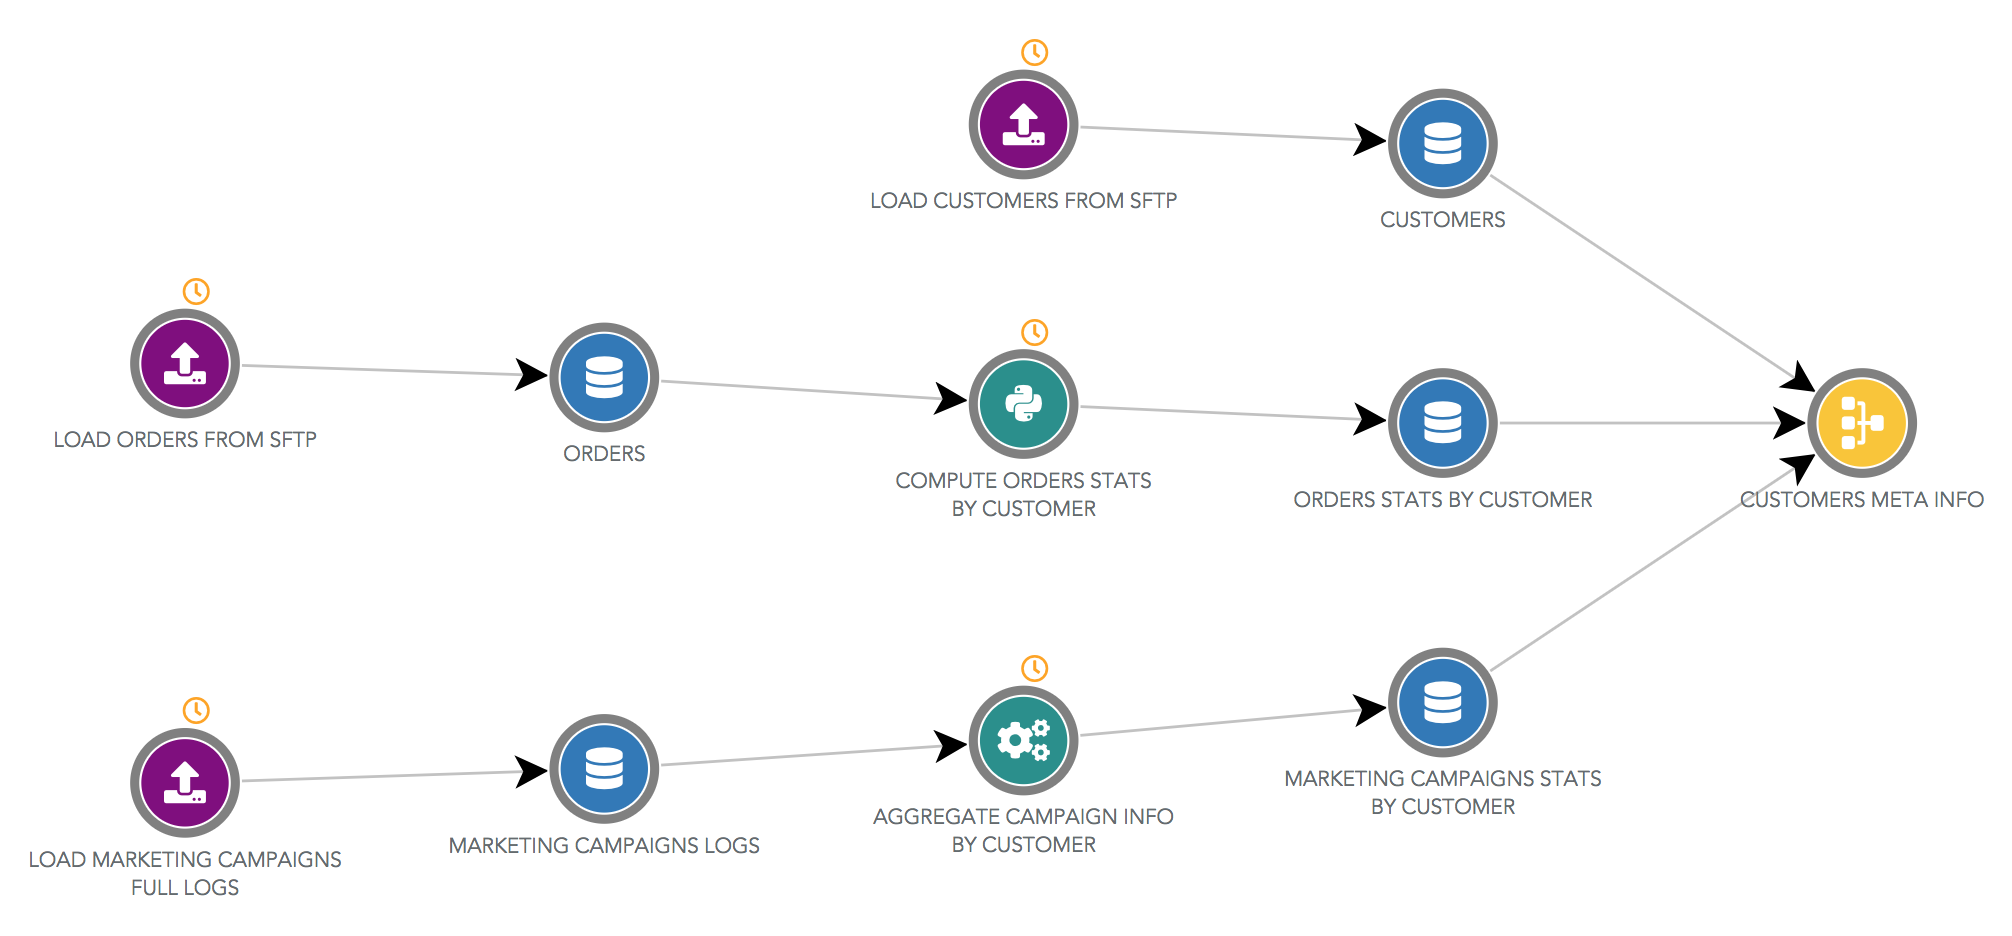
Datasource are shown in blue circles.
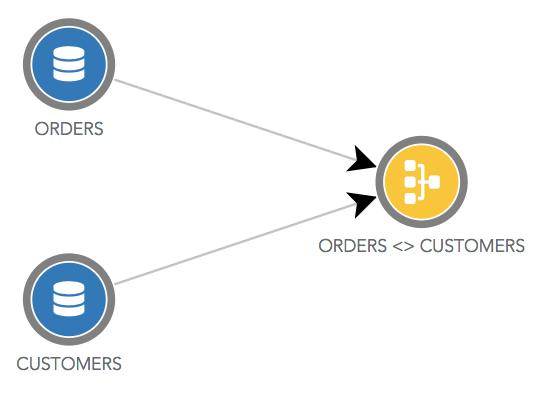
There is one exception for join datasources which use yellow circles. In the below dataflow, the datasource named "ORDERS <> CUSTOMERS" is a join between the datasource "ORDERS" and the datasource "CUSTOMERS".
Automation
ETL Step
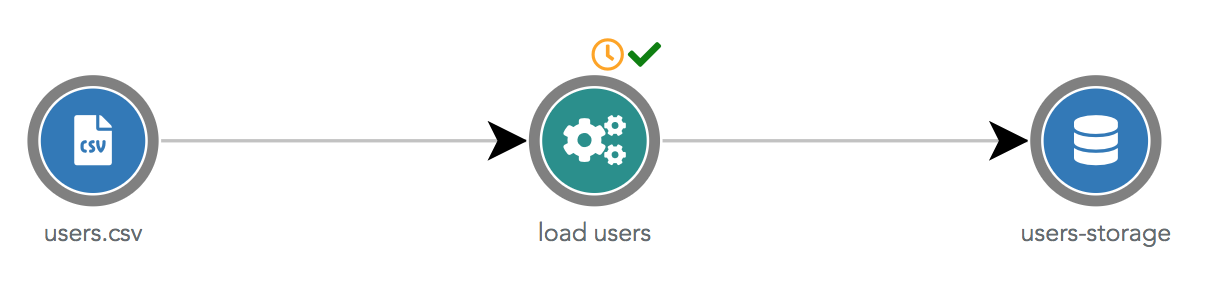
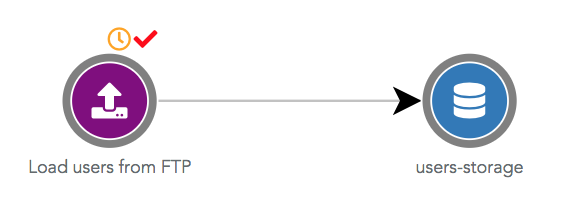
ETL steps are shown in green circles. In the dataflow below, the ETL Step named "load users" uses the input datasource "users.csv" and sends the transformed data in the output datasource "users-storage".
The orange clock icon above the circle indicates that this automation is scheduled (or triggered by a chain-task which is scheduled). The green check icon means the last status of this automation is success (that would be red if the status was failure).
(S)FTP Import
(S)FTP import are shown in purple circles. (S)FTP imports only have an output datasource.
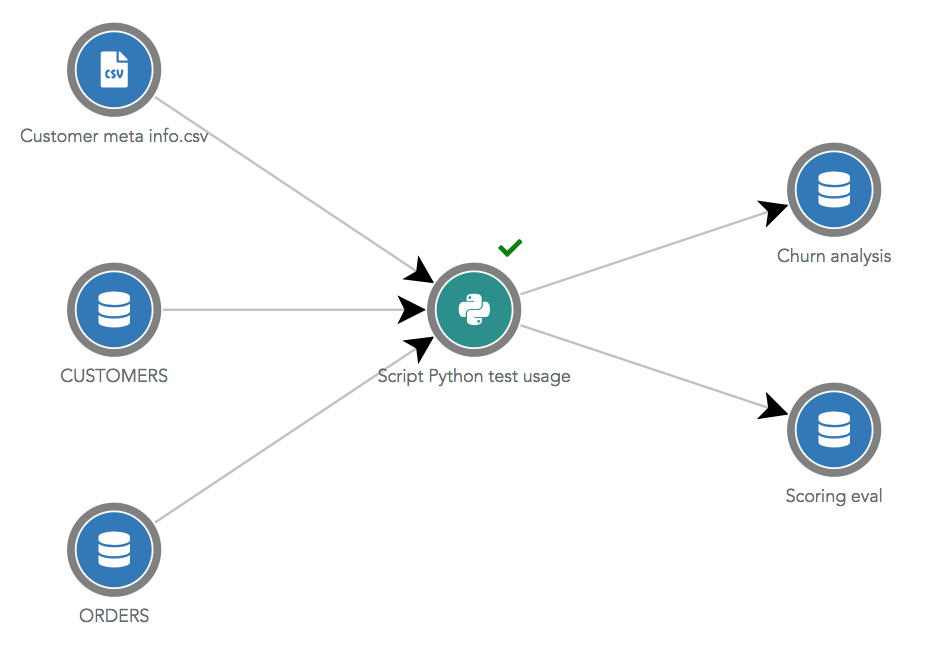
Python Script
Python scripts are shown in green circles with the Python icon. Python scripts can use many different datasources as
input or output. To appear correctly in the dataflow, the datasources used as input and output must be manually
specified in the Python object page, in the Usage tab.
Specifying the input and output used datasources of a Python script is a good practice!
If the input and output datasources are not specified in the usage tab, a Python script will not be displayed in the dataflow. Moreover, if you delete a datasource used by this script, Serenytics will refuse the deletion. If you didn't declare it, Serenytics cannot detect it is used and thus the deletion will be accepted and your script broken. In practice, there is another safety check: if a datasource uuid appears in the script code, its deletion will be refused (but this is not safe enough as you may have obtained a datasource by its name in the python code).
Filtering the dataflow
Show only scheduled flow
By default, when you open the dataflow, it only shows the scheduled automations (and their input and output datasources). If an automation is not scheduled but is triggered by a scheduled chain-task, it is also shown. This is also true if the automation is triggered by a not-scheduled chain task which is itself triggered by a scheduled chain-task (and so on).
Join datasources using datasources whose data is changed by a scheduled automation will also be displayed.
Show dataflow leading to a datasource
When you are in the Usage tab of a datasource, you can click on the link called Show dataflow leading to this
datasource. It will open the dataflow with only the flow that is used to build this datasource. This is a quick way
to understand how a particular datasource has been built.
This filter is shown in the top right corner of the dataflow page. You can remove it by clicking on the cross beside the datasource name.