Widgets
Simple table
In a simple table, you can aggregate your data with as many dimensions as your want and display the corresponding
measures. You can also add computed measures. A computed measure ia a column that is obtained as a formula using
other columns content. In the screenshot below (which is a folded table), the column average basket is a computed
measure obtained with the formula: line[4]/line[3].
Folding
If you enable the folding option (in the rows folding menu), the user can click on the ± icons in the first column:
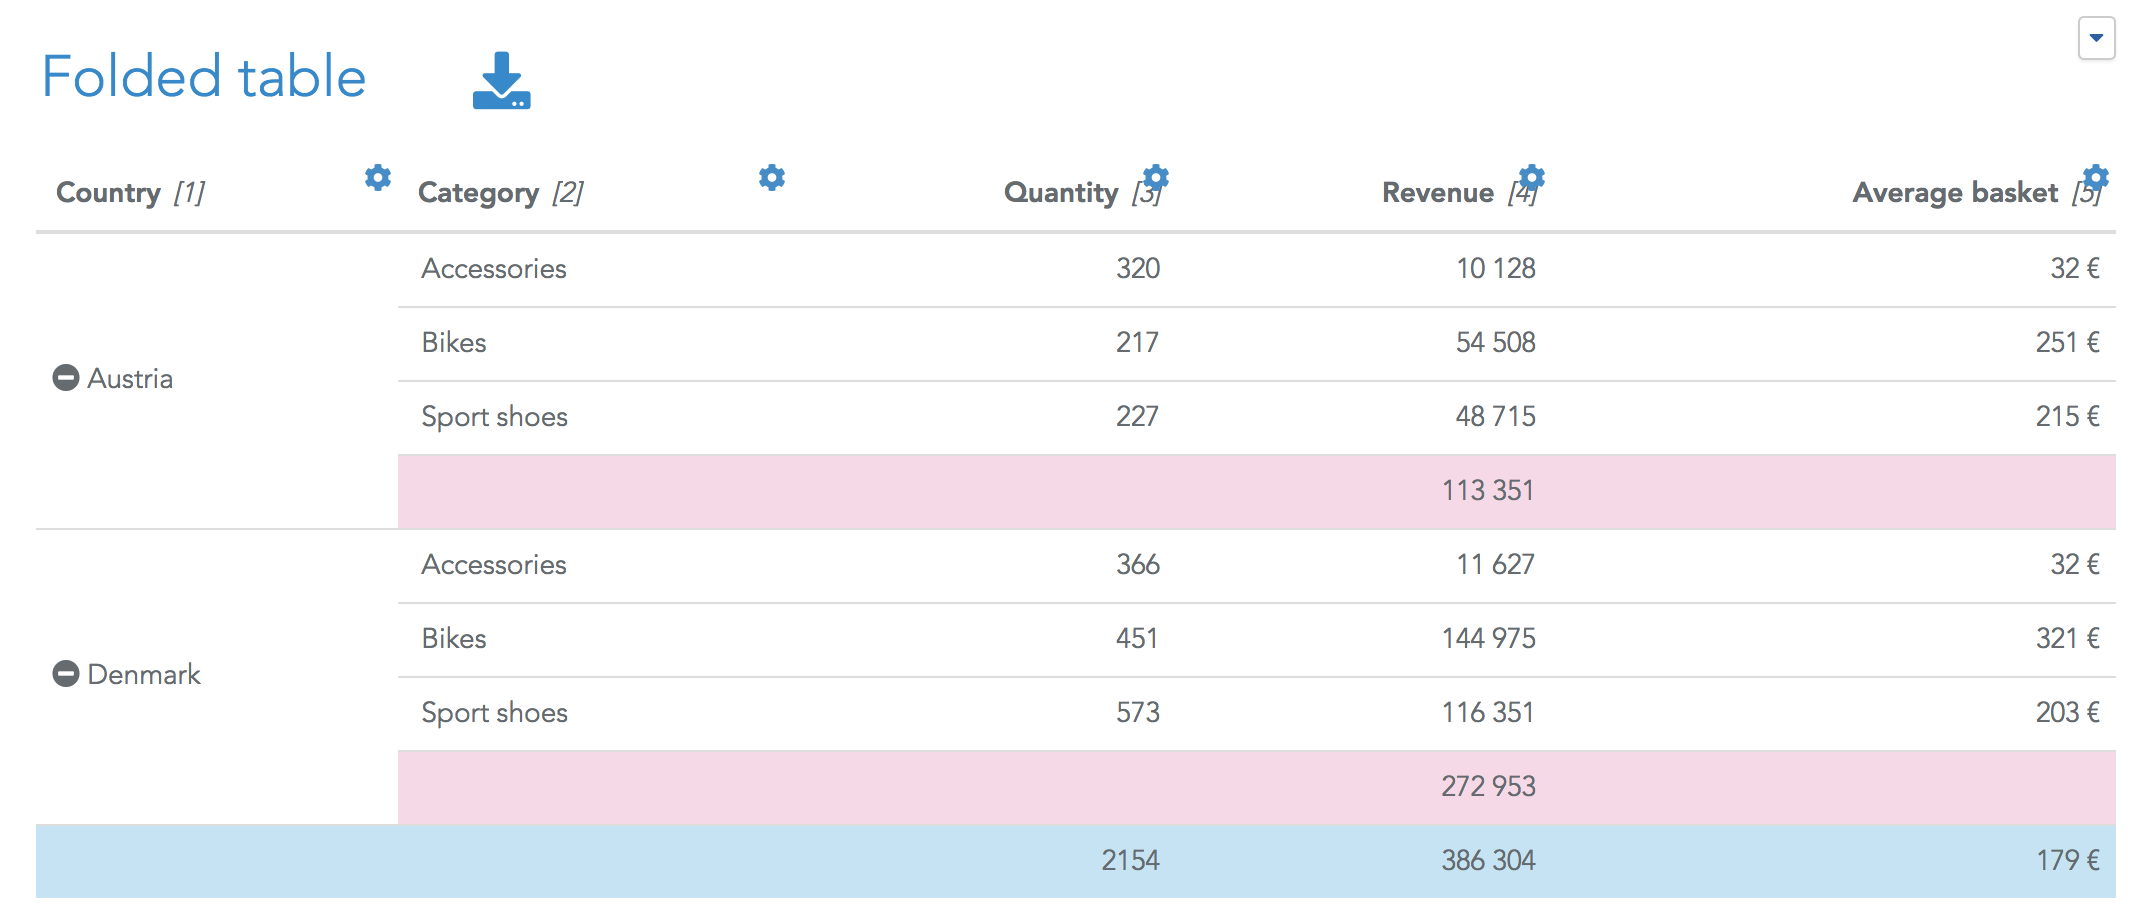
In a folded table, the blue row is the grand total, and pink rows are intermediate totals. The grand total is only
displayed if the option Display total is enabled for at least one column. To hide the intermediate total of a column,
use the column formatting option Hide intermediate total.
KPI widgets
A KPI widget is used to show high-level KPIs (e.g. current year revenue, percentage value...). You can change the template to change the rendering of the widget.
List of icons
In some templates, you can choose an icon to be show in the widget. The list of available icons is available here.
Free table
The free table lets you configure cells one by one. Each cell can be of mode:
text: the cell content is a simple text.value: the cell content is obtained from one datasource query.formula: the cell content is a formula based on other cells.
HTML mode
When the HTML mode is enabled for a cell, the HTML code provided will be rendered into this cell.
When a cell is in value mode, {{valueN}} can be used to obtain the Nth value configured in the data menu. Note that
the Computing formula and the Numeral formatting are already applied to the value.
It's also possible to use simple expressions such as: {{value2>=0 ? "green" : "red"}} or to use any dashboard function.
Using values and numeral formatting
If you apply a numeral formatting (e.g. with option "12.34%" to format the value as a percentage), the
corresponding {{valueN}} returns a string including the percentage sign. If you write {{valueN*2}} or
{{valueN >0 ? "a" : "b"}} an error will be returned.
In this case, you need to convert valueN to a number. To do that, use the toNumber
function, e.g.: {{toNumber(valueN)*2}}.
Example:
<div style="background-color:#fafafa;
            color:black;
            height:100%;
            text-align:left;
            padding-left:1vw;
            padding-top:1vw;
            padding-bottom:1vw;
            display:flex;
            flex-direction: column;
            justify-content:space-around">

    <div style="color:rgb(77, 144, 147); font-size:1.4vw">
        Turnover
    </div>

    <div style="font-size:2.5vw; color:rgb(0, 96, 100)">
        {{value1}}
    </div>

    <div style="font-size:1.2vw; color: {{value2>=0 ? "green" : "red"}}">
        <span class="fa fa-angle-double-{{value2>=0 ? "up" : "down"}}"></span>
        {{value2}} vs Month-1
    </div>
</div>
Buttons
This widget allows you to add buttons into your dashboard. Each button can either:
- Trigger an automation (of any type)
- Download the full content of a Storage
- Download a static file (i.e. a file of any type (pdf, xlsx, ppt...) that you previously uploaded in Serenytics)
- Set a variable's value
- Open a link
- Open a tab
- Execute Javascript code
In the studio, you cannot click on a button to trigger its action (as the click on a widget is used to select a widget).
If you want to trigger the action of a button, you need to click on Simulate click in the button's settings menu.
Trigger an automation
To enable an automation to be run by other users than yourself, you need to enable the option
named All all users to run this script. This option is in the Advanced tab of the automation's settings. If you
don't enable this option on the script, its execution from a dashboard will return an error. This is a security setting
to ensure that by default, an automation cannot be run by all users.
When a button linked to an automation is clicked, the automation is put in the execution queue in the server. Once there is some resource available to execute it, it will be executed. In most cases, a resource is available immediately. But in some occasions, the user might have to wait for the execution to start.
Once an automation is started, the user cannot stop it. Even if he closes the task window, the automation will continue its execution.
An automation can only have one instance running. If an automation is triggered, and then it is triggered again while it is already running, the second execution will return an error message. This can happen if you share a dashboard with buttons to multiple users and they click on a button triggering an automation at the same time.
Pass parameters to a Python script
In the settings of a button, you can specify a JSON. If your automation is a Python script, this JSON can be retrieved in the Client object:
Example:
import serenytics
client = serenytics.Client()

params = client.script_args
print(params)
Variables from dynamic filters and input fields
If you have created dynamic filters or input fields that store their values into variables, these values are also
passed to the python scripts triggered by a dashboard button. They can also be retrieved in the script_args field.
This is a simple way to ask parameters to a user in a dashboard and then have a button executing a Python script
using these parameters.
Download the full content of a storage
This type of button only works for Storage datasource. When the button is clicked, a popup will ask the user for some file settings (csv separator, quotes).
Download a static file
With this option, when the user clicks on the button, a file will be downloaded. The files to be downloaded must be
previously uploaded in the Admin section, in the Static File tab.
There are two modes to specify the file to download:
- Static: you need to select the filename within the list of your files.
- Dynamic: you can dynamically build the filename using variables, for example:
my-report-{{varYear}}.xlsxwherevarYearis a variable in your app.
Set a variable's value
A click on the button will set the variable to a given value.
Open a link
A click on the button will open a new URL. You can specify if you want this new URL to be opened in the same window or in a new one (default mode).
You can use variables in your URL
For example, you can use https://www.google.com/search?q={{myVariable}}. This can be used to redirect the user
to a given page in another webapp, using a URL such as: https://www.myApp.io/products/{{productId}}
Open a tab
A click on the button will open another tab from the app. You must provide the tab index (1 is for the first tab).
This also works if your tabs are hidden
When the Show tabs option is disabled in the Layout & Print menu, these buttons will still work.
So you can create your own navigation menu using these buttons and disabling the default tabs buttons.
Execute Javascript Code
A click on the button will execute the provided Javascript code.
You can use the helpers provided by Serenytics to have interactions with your app: Javascript helpers
Map
Popup configuration
By default, the popup (when you click on a marker) displays the Label column and a list of the selected measures. You
can configure what is displayed in the popup by filling in the Popup HTML template field.
The HTML code provided can contain formulas inside double curly brackets: {{line[1]}}. The available variables are:
value: contains the value of theLabelcolumnline[N]: contains the value of the Nth selected measure column
Example:
<h4>{{value}}</h4>

<strong>Population: </strong>{{line[1]}}
<br>
<strong>Altitude : </strong>{{line[2]}}
Custom widget
The "custom" widget lets you code your own widgets. The simplest widgets use only HTML and CSS. For more advanced widgets (mostly widgets with interaction such as filters), you can also use Javascript (see here for a list of helpers to add interactions in your widgets).
Retrieving data in the widget code
In the data configuration of the widgets, configure the dimensions and metrics like for any other widget.
Then, in the HTML code, you can retrieve this data using the variables:
data_rows: contains the list of rows (usedata_rows[1][1]to get first value of first row)data_headers: contains the list of headersdata_nb_rows: contains the number of rows in the datasetdata_row_length: contains the length of each row (i.e. this is also the number of headers)
So the simplest widget to show these values would be:
<div>
    Rows: {{data_rows}}
</div>
<div>
    Headers: {{data_headers}}
</div>
<div>
    Nb rows: {{data_nb_rows}}
</div>
<div>
    Length of each row: {{data_row_length}}
</div>
The {{xxx}} syntax means the content is interpreted by the Serenytics interpreter.
This interpreter has access to the four variables described above.
But it also has access to all the dashboard variables (and filters' variables). And all the
dashboard formulas are also available.
You can use condition using the syntax:
{{myCondition ? value_if_true : value_if_false}}.
Create a library of custom widgets using Snippets
Usually, you want to re-use the code of a custom widget in several dashboards. To do that, write your widgets' code in Snippets and reference thme in your custom widgets in dashboards.
See the full Snippets documentation. We strongly encourage you to read the Snippet documentation as there are many explicit examples.
Older (and obsolete) version
In previous version your could retrieve the data using the strings {{rows}} and {{headers}} in your code. It is
still working but we advise to use the new variables.
Example:
<script>
    var rows = JSON.parse('{{rows}}');
    var headers = JSON.parse('{{headers}}');

    console.log('data rows:', rows);
    console.log('data headers:', headers);
</script>
If you have a data set where you selected two headers Country and Amount, the following code will be executed:
<script>
    var rows = JSON.parse('[["France",470], ["USA":2550]]');
    var headers = JSON.parse('[{"name":"Country","type":"str"},{"name":"Amount","type":"float"}]');

    console.log('data rows:', rows);
    console.log('data headers:', headers);
</script>
Example to show a simple table
Here is an example that will get the data configured in your widget and show it in a simple table.
<div id="customWidget" style="overflow: auto; height: 100%;"></div>

<script>
    function renderTable() {
        // --- Retrieve data from Serenytics template injection
        var rows = JSON.parse('{{rows}}');
        var headers = JSON.parse('{{headers}}');

        if (!rows) {
            console.log('data is not yet loaded');
            return;
        }


        var table = document.createElement('table');
        table.style.width = '100%';
        table.style.borderCollapse = 'collapse';

        var thead = document.createElement('thead');
        var headerRow = document.createElement('tr');
        headers.forEach(header => {
            var th = document.createElement('th');
            th.textContent = header.name;
            th.style.border = '1px solid #ddd';
            th.style.padding = '8px';
            th.style.textAlign = 'left';
            th.style.backgroundColor = '#f2f2f2';
            headerRow.appendChild(th);
        });
        thead.appendChild(headerRow);
        table.appendChild(thead);

        var tbody = document.createElement('tbody');
        rows.forEach(row => {
            var tr = document.createElement('tr');
            row.forEach(cell => {
                var td = document.createElement('td');
                td.textContent = cell;
                td.style.border = '1px solid #ddd';
                td.style.padding = '8px';
                tr.appendChild(td);
            });
            tbody.appendChild(tr);
        });
        table.appendChild(tbody);

        var container = document.getElementById('customWidget');
        container.appendChild(table);
    }

    renderTable();

</script>

<style>
    #customWidget table {
        font: 12px sans-serif;
        vertical-align: middle;
        text-align: left;
        border-collapse: collapse;
    }

</style>
Example to show a table with a popup when a value is clicked
In this example, the third column will have a link to open a popup instead of the cell's value. The popup will show the value.
<div id="customWidget" style="overflow: auto; height: 100%;"></div>

<script>
    function showCustomPopup(message) {
        // Create a popup element
        var popup = document.createElement('div');
        popup.textContent = message;
        popup.style.position = 'fixed';
        popup.style.top = '50%';
        popup.style.left = '50%';
        popup.style.transform = 'translate(-50%, -50%)';
        popup.style.padding = '20px';
        popup.style.backgroundColor = 'white';
        popup.style.border = '1px solid #ddd';
        popup.style.borderRadius = '10px';
        popup.style.boxShadow = '0px 4px 8px rgba(0, 0, 0, 0.2)';
        popup.style.zIndex = '1000';

        // Add a close button
        var closeButton = document.createElement('button');
        closeButton.textContent = 'Close';
        closeButton.style.marginTop = '10px';
        closeButton.className= 'btn btn-primary'
        closeButton.onclick = function () {
            document.body.removeChild(popup);
        };

        var space = document.createElement('div');
        popup.appendChild(space);
        popup.appendChild(closeButton);
        document.body.appendChild(popup);
    }

    function renderTable() {
        // --- Retrieve data from Serenytics template injection
        var rows = JSON.parse('{{rows}}');
        var headers = JSON.parse('{{headers}}');

        if (!rows) {
            console.log('data is not yet loaded');
            return;
        }


        var table = document.createElement('table');
        table.style.width = '100%';
        table.style.borderCollapse = 'collapse';

        var thead = document.createElement('thead');
        var headerRow = document.createElement('tr');
        headers.forEach(header => {
            var th = document.createElement('th');
            th.textContent = header.name;
            th.style.border = '1px solid #ddd';
            th.style.padding = '8px';
            th.style.textAlign = 'left';
            th.style.backgroundColor = '#f2f2f2';
            headerRow.appendChild(th);
        });
        thead.appendChild(headerRow);
        table.appendChild(thead);

        var tbody = document.createElement('tbody');
        rows.forEach((row, rowIndex) => {
            var tr = document.createElement('tr');
            row.forEach((cell, colIndex) => {
                var td = document.createElement('td');
                td.textContent = cell;
                td.style.border = '1px solid #ddd';
                td.style.padding = '8px';

                // Add click event for the popup
                if (colIndex ===2) {
                    td.style.cursor = 'pointer'; // Add pointer cursor to indicate interactivity
                    td.textContent = "Résumé";
                    td.onclick = function () {
                        showCustomPopup(`${cell}`);
                    };
                }

                tr.appendChild(td);
            });
            tbody.appendChild(tr);
        });
        table.appendChild(tbody);

        var container = document.getElementById('customWidget');
        container.appendChild(table);
    }

    renderTable();

</script>

<style>
    #customWidget table {
        font: 12px sans-serif;
        vertical-align: middle;
        text-align: left;
        border-collapse: collapse;
    }

</style>
Loading Javascript or CSS libraries
If you use one or more 3rd party javascript librairies, you need to load them with our helper function
serenyticsLoadAllScripts(list_of_urls, callback) as shown in the example using D3.js below.
Using third party javascript or CSS libraries
Of course you can use 3rd party libraries such as D3.js to code widgets exactly as you want.
However, you should only load libraries that are not already used by the Serenytics application, such as D3.js or Highcharts. You should not try to load a different version of a library already used by Serenytics (such as ChartJs, Angular, Lodash, and more). You should not either load a different version of a CSS library already used by Serenytics, such as Bootstrap.
If you are not sure, please contact Serenytics support. Otherwise your widget could break in a future upgrade of the Serenytics platform.
Complete example using D3.js
<!--
    For this example to work, you need to select 2 columns in the Data config menu.
    The first column will be used as labels and the second one as numerical values.
-->

<div id="customWidget" style="overflow: auto; height: 100%;"></div>

<script>
    function main() {
        // --- Retrieve data from Serenytics template injection
        var rows = JSON.parse('{{rows}}');
        var headers = JSON.parse('{{headers}}');

        if (!rows) {
            console.log('data is not yet loaded');
            return;
        }

        // --- Create a table with inline bars using d3.js

        var table = d3.select("#customWidget").append("table");

        // Create a table with rows and bind a data row to each table row
        var tr = table.selectAll("tr.data")
            .data(rows)
            .enter()
            .append("tr")
            .attr("class", "datarow");

        // Apply style to even rows
        d3.selectAll(".datarow").filter(":nth-child(even)").attr("class", "datarow even")

        // Create the label column
        tr.append("td").attr("class", "data name")
            .text(function (d) {
                return d[0];
            });

        // Create the value column
        var formatValue = d3.format(".2f");
        tr.append("td").attr("class", "data value")
            .text(function (d) {
                return formatValue(d[1]);
            })

        // Create the chart column
        var chart = tr.append("td").attr("class", "chart");

        // Create the div structure of the chart
        chart.append("div").attr("class", "bar");

        // Create the scale to compute bar width
        var xScale = d3.scaleLinear()
            .domain([0, d3.max(rows, function (d) {
                return d[1];
            })])
            .range(["0%", "100%"]);

        // Creates the chart bars
        tr.select("div.bar")
            .style("width", "0%")
            .transition()
            .duration(500)
            .style("width", function (d) {
                return xScale(d[1]);
            });
    }

    serenyticsLoadAllScripts(
        ["https://cdnjs.cloudflare.com/ajax/libs/d3/4.7.3/d3.min.js"],
        main
    );
</script>

<style>
    #customWidget .chart {
        width: 300px;
        padding-left: 20px;
    }

    #customWidget .bar {
        height: 17px;
        float: left;
        background-color: steelblue;
    }

    #customWidget table {
        font: 14px sans-serif;
        vertical-align: middle;
        text-align: left;
        border-collapse: collapse;
    }

    #customWidget td,th {
        padding-top: 2px;
        padding-bottom: 2px;
    }

    #customWidget tr.even {
        background-color: whitesmoke;
    }

    #customWidget th {
        padding-left: 10px;
    }

    #customWidget td.data {
        padding-left: 10px;

    }
    #customWidget td.value {
        text-align: right;
    }
</style>