Dashboard formulas
There are 2 kinds of formulas: Compute and Rendering.
Use a Compute formula if you want to apply a calculation on the cell value. Excel exports will use the results of the
calculation. If you want to apply a formula to change the cell presentation (e.g. icons, html code), use a
Rendering formula. This calculation won't be applied when exporting data to Excel.
Note that the data is first transformed by the Compute formula, the result is then passed to the numeral formatting
(if there is one), and then the result is passed to the Rendering formula.
Numeral formatting and rendering formula
If you apply a numeral formatting to your data (e.g. 1 000 or 12.34%), this formatting is applied to the data
before it is passed to the rendering formula. For example, if the input data is the number 67425 and the numeral
formatting is 1 000 then the input of the rendering formula will be 67 425.
This value is a string containing a white space. If you use a conditional formula (e.g.
value > 50000 ? "large" : "small"), it won't work. The condition will always be true.
You need to convert the input string to a number with the toNumber() function (e.g.
toNumber(value) > 50000 ? "large" : "small").
Variables available in a formula
valueis the current cell value.line[N]is the value of the cell of the Nth column on the current line (first column isline[1]).aboveLine[N]is the value of the cell of the Nth column on the line above the current line.belowLine[N]is the value of the cell of the Nth column on the line below the current line.lineIndexis the line index in the array (first line has index 1).isFirstLinetrue if the current cell is in the first line of the array.isLastLinetrue if the current cell is in the last line of the array.
In free-tables
There is an extra variable available only in free-table that lets you access the value of any cell in the table:
data[rowId, columnId]is the value of the cell at rowrowIdand columncolumnId.data[1,1]is the top-left cell.
Here is a guide to use this feature to compute an advanced value (based on hidden intermediate values) in a KPI using a free-table:
- create a Free-table widget and configure it to have a single row
- configure the leftest cells in Value mode and compute intermediates values in those cells
- in the rightest cell, use the Formula mode, and in the compute formula (in the Formatting section), enter the formula
to compute the KPI based on other cells, e.g.
data[1][1] + data[1][2] - in the
Columns widthsmenu, you can now hide the leftest cells by setting their widths to 0
This way, you can create advanced KPIs based on several queries on several datasources.
In bar charts / curve charts
In a formula, line[1] stands for the X axis, and line[2], ... line[N+1] are the N selected measures.
Example:
If you selected 2 measures Margin and Sales, you can enter in the field "Computed formula" the following formula:
line[2] / line[3] * 100
to get a percentage of the margin vs the sales. It's also possible to hide the Sales measure if you only want to
display the percentage by clicking on "Hide measure".
Split by mode
Using multiple measures (and so also formulas) is not available when using "Split by" mode
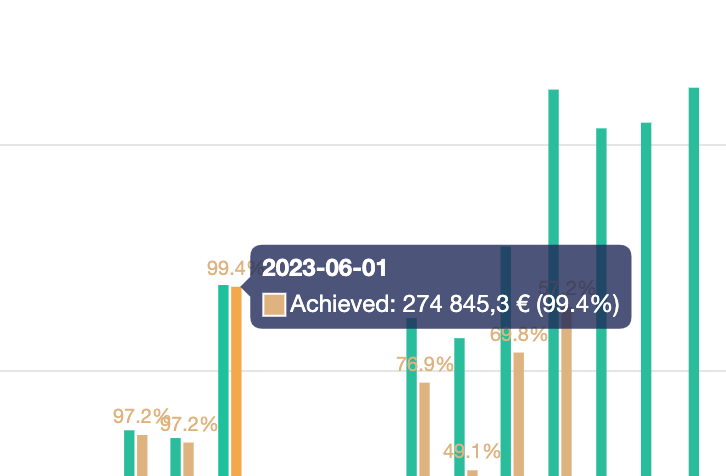
Apply a different rendering in a toolip
The variable isTooltip (1 or 0) is added to the variables and allow you to build a different rendering when
you are in a tooltip. For example, you can use:
isTooltip ?  (value + " (" +(round((line[3] / line[2]) * 100 , 1) + "%") + ")") : (round((line[3] / line[2])
* 100 , 1) + "%")
This leads to the below result: the value displayed is only a percentage while the tooltip has the absolute value
and the percentage:
Note about variables
The value(s) available with one of the variables above (e.g. value, line, data...) is the output of the
Compute formula. The Rendering formula is not applied before returning a variable value.
Examples of Compute Formulas
- Simple formula
value / 2
- Column 2 divided by column 1
line[2] / line[1]
- Simple conditional
value >= 20 ? "large" : "small"
- Evolution from line below
isLastLine ? "n.a." : (line[1] - belowLine[1])/belowLine[1]
- Accumulation of column 1 values in column 2
aboveLine[2] + line[1]
- Number of days between a date and now
date_diff(value, now())
Examples of Rendering Formulas
- Conditional with icon
value >= 20 ? (icon("arrow-up", "green") + value) : (icon("arrow-down", "red") + value)
- Evolution from line below with icons
isLastLine ? "n.a." : (line[1] > belowLine[1]) ?
("+" + round((line[1] - belowLine[1]) / belowLine[1] * 100, 2) + " % " + icon("arrow-up", "green"))
:
(round((line[1] - belowLine[1]) / belowLine[1] * 100, 2) + " % " + icon("arrow-down", "red"))
String Syntax
String must be within double quotes (e.g.: replace(value, "k", "kilo") and not within simple quotes.
Conditions syntax
You can write a condition with the syntax:
condition ? value_if_true : value_if_false.
For example, you can write: value > 100 ? "Large" : "Small".
Generate HTML code
In various places (e.g. in a table's column), you can use the rendering formula to generate HTML code.
For example, in a table, if you want to display the value of a column, and below, the value of the first column of the table, in color red with a small font, you can use:
value + "<br>" + "<span style=font-size:8px;color:red>(" + line[1] + " items)</span>"
Available functions
icon()
Inserts an icon with the given color. See here for the full icon set.
Parameters:
icon_name: icon to usecolor[optional]: icon color.
Example:
icon("flag", "red")
icon_del_table_row()
Inserts a trash icon in a table that triggers the deletion of a data row when clicked, and then triggers a widgets'
refresh.
The table must have an id column.
Parameters:
datasource_uuid: datasource where to delete the row.id: value of theidcolumn in the row to delete.
Example:
// In a table, the variable `datasource_uuid` is defined and contains the uuid of the table's datasource.
// Here, line[2] should contain the `id` column.
icon_del_table_row(datasource_uuid, line[2])

// a raw example
icon_del_table_row("af775026-b229-4fbb-9974-a8a268df6d00", 20)
link()
Inserts the link text pointing to url. You can use variables to dynamically create the link (e.g. from other columns
of a table).
Parameters:
text: text to displayurl: url to openmode[optional]: can be"same"or"new".
If mode is "new" or not set, the link will be opened in a new window.
If mode is "same", the link will be opened in the same window when clicked.
Example:
link("Serenytics", "https://www.serenytics.com", "new")

// if the 5th column of a table contains a product ID:
link("Product infos", "https://www.mywebsite.com/product/" + line[5] + "/overview", "new")

// if the current column contains a product ID
link("Product infos", "https://www.mywebsite.com/product/" + value + "/overview", "new")
link_to_dashboard()
Inserts the link text pointing to the dashboard with uuid uuid, with the option to filter the destination dashboard
with a payload.
Parameters:
text: text to displayuuid: uuid of the dashboard to link to.mode[optional]: can be"same"or"new".payload_filter[optional]: the payload field name.payload_value[optional]: the payload value forpayload_filter.
If mode is "new" or not set, the link will be opened in a new window.
If mode is "same", the link will be opened in the same window when clicked.
If both payload_filter and payload_value are defined, the payload {payload_filter: payload_value} will be passed to
the dashboard. This payload can be used in a global static filter (see
template dashboard).
Example:
link_to_dashboard("User info", "176a8ac8-5c85-4fd0-b960-bad858f986e0", "new", "user_id", 10)
// the payload passed to the dashboard will be {"user_id": "10"}

link_to_dashboard("User info", "176a8ac8-5c85-4fd0-b960-bad858f986e0", "new", "user_id", line[1])
// this example shows how to filter the destination dashboard with the user id contained in line[1]
btn_run_automation()
Inserts a button triggering an automation. This can be used in a table to add a button per row that triggers a Python script. The button can pass values from the table rows to the Python script.
Parameters:
btn_title: title of the button to displayautomation_uuid: uuid of the automation to run- other args: payload passed as list of key,values args (see example below). Whites spaces in keys or values are not supported and are removed before being passed to the script.
If the automation is a Python script, the payload can be retrieved in the dict client.script_args.
Example:
// example without payload
btn_run_automation("My button", "176a8ac8-5c85-4fd0-b960-bad858f986e0")

// example with a payload with two keys
// the value associated with myKey1 is the hard-coded string "Content"
// the value associated with myKey2 is the variable in column 2 of the table row
btn_run_automation("My button", "176a8ac8-5c85-4fd0-b960-bad858f986e0", "myKey1", "Content", "myKey2", line[2])
btn_set_row_field_value()
Inserts a button in a table that will set a field value in a given table row (and then refreshes the widgets).
Parameters:
btnText: text of the buttondatasource_uuid: the uuid of the datasource where to update the fieldid: id value of the row to updatefield_name: name of the field to updatevalue: value to set to the value
Example:
// In a widget's formula, the variable datasource_uuid contains the uuid of the widget's datasource
// Here, line[1] is the column that contains the ID of the row
// This button will set the value of the column "status_field" to "DONE"
btn_set_row_field_value("Mark as done", datasource_uuid, line[1], "status_field", "DONE")

//a more raw example:
btn_set_row_field_value("Mark as done", "176a8ac8-5c85-4fd0-b960-bad858f986e0", 0, "status_field", "DONE")

// if you have two status (TODO and DONE), you can show the correct button to the user with this formula:
// (we assume line[3] shows the status for a given row.)
line[3] == "TODO" ?  btn_set_row_field_value("Mark as done", datasource_uuid, line[1], "status_field", "DONE") :
    btn_set_row_field_value("Mark as todo", datasource_uuid, line[1], "status_field", "TODO")
create_source_file_url()
This function is obsolete and will be removed soon
To allow full download of a datasource in a dashboard by a Viewer, please read the doc here.
Returns an URL to download the file of the source with uuid uuid. The returned URL is valid only if the data source
is used at least within
one widget of the dashboard (this is a security constraint) and the option Allow download file in viewer must be
enabled on the data source.
Parameters:
uuid: uuid of the data source.
Example:
create_source_file_url("176a8ac8-5c85-4fd0-b960-bad858f986e0")
How to use create_source_file_url:
Create a KPI widget, select the source you want to download in its data configuration. In the rendering section, choose the template Custom HTML. Then paste this HTML code:
<div style="padding:20px; background-color: lightblue; height: 100%;font-size: 2vw">
    <a href={{create_source_file_url("413faa5a-e859-cf99-a1be-e0ff63878a82")}}>Download file</a>
</div>
Error handling for create_source_file_url
If you have issues using this function, open the developer console of your browser. Errors from this function are displayed there.
mailto()
Shows a link to send an email to the recipient email, with subject subject and email body body.
Parameters:
text: text to display as a linkemail: email recipientsubject: email subjectbody: email body
Example:
mailto("Send Email", "contact@serenytics.com", "Email from dashboard", "Hello<br>Can you update your settings?")
replace()
Replaces string s1 by string s2 in string str.
Parameters:
str: input strings1: string to replaces2: new string
replace("2016-02-28", "-", "/")
repeat()
Repeats the str string N times.
Parameters:
str: string to repeatN: number of times to repeat
Example:
repeat(icon("star", "orange"), 3)
padLeft()
Pads str on the left side with chars if it's shorter than length.
Parameters:
str: input stringlength: output string lengthchars[optional]: characters to use to pad the input string
Example:
padLeft(value, 2, "0")
round()
Rounds the value val to N decimals.
Parameters:
val: input valueN: number of decimals in the output value
Example:
round(value, 2)
floor()
Rounds the value val to the closest integer downward.
Parameters:
val: input value
Example:
floor(value)
fix()
Rounds the value val to an integer toward zero.
Parameters:
val: input value
Example:
fix(value)
abs()
Returns the absolute value of val.
Parameters:
val: input value
Example:
abs(value)
pow()
Calculates the power of x to y.
Parameters:
x: input valuey: power to use
Example:
pow(value, 2)
sqrt()
Computes the square root of val.
Parameters:
val: input value
Example:
sqrt(value)
sign()
Computes the sign of val, either -1,+1 or 0 (if val is 0).
Parameters:
val: input value
Example:
sign(value)
now()
Returns the current datetime, in UTC in ISO format.
Example:
now()
formatNumeral()
Formats a number.
Parameters:
inputString: input value.format: output format. To be chosen within values listed in menu Numeral (e.g. "1 000", "1 000.23 $"...).decimal_sep: decimal separatorthousand_sep: thousand separatorcurrency_symbol: currency symbol
Example:
formatNumeral(value, "1 000 $",".", " ","€")
formatDate()
Formats inputDateString with the format given by outputFormatString (e.g. "YYYY - MM - DD", "LLLL").
IfinputDateString is not in ISO format, specify its format with inputFormatString (e.g. "YYYY-MM-DD", see
here for all possible values). See
here for a complete documentation about available output formats.
Parameters:
inputDateString: input stringoutputFormatString: output string formatinputFormatString[optional]: input string format
Example:
formatDate(value, "YYYY - MM - DD", "YYYY/MM/DD")
formatDateWithLocale()
Use this function instead of formatDate when you want to set the locale to use for the output format.
Parameters:
inputDateString: input stringoutputFormatString: output string formatlocale: locale to useinputFormatString[optional]: input string format
Example:
formatDateWithLocale(value, "LLLL", "fr")
date_diff()
Returns date2 - date1 in days.
Parameters:
date1: first datedate2: second date
Example:
date_diff(line[1], line[2])
dateAdd()
Add (or substract) a period of time to a date (or datetime).
Parameters:
inputDate: input datenbUnits: number of time units to add (or substract)timeUnit: time unit, can be"years","quarters","months","weeks","days","hours","minutes","seconds"or"milliseconds"outputFormat[optional] : output format (default format is 'YYYY-MM-DD')
Example:
dateAdd("2017-06-21", 2, "months") // returns 2017-08-21
dateAdd("2017-06-21", -1, "years") // returns 2016-06-21
toNumber()
Convert val to number.
Parameters:
val: value to convert
Example:
toNumber("12.34%") // returns number 12.34
toNumber("367 345 euros") // returns number 367345
left()
Extract characters at the beginning of a string.
Parameters :
s: input stringn: number of characters to keep
Example:
left("John Doe", 3) // returns "Joh"
right()
Extract characters at the end of a string.
Parameters :
s: input stringn: number of characters to keep
Example:
right("John Doe", 3) // returns "Doe"
removeLeft()
Remove characters at the beginning of a string.
Parameters :
s: input stringn: number of characters to remove
Example:
removeLeft("John Doe", 3) // returns "n Doe"
removeRight()
Remove characters at the end of a string.
Parameters :
s: input stringn: number of characters to remove
Example:
removeRight("John Doe", 2) // returns "John D"
getLoginMetadata()
Returns a given field from the user's metadata.
Parameters :
s: meta data field (or dot-separated path)d: default value to return if the field does not exist
Example:
// returns the field "country" of the user's metadata
getLoginMetadata("country")

// returns the field "city.name" of the user's metadata, and returns Paris if the path does not exist
getLoginMetadata("city.name","Paris")
getLoginUsername()
Returns the user's login (i.e. its email).
Example:
getLoginUsername() // returns john@doe.com
link_to_static_file
Creates an URL pointing to a static file to download, from the UUID of the statc file.
Parameters:
uuid: UUID of the static file to download
Example:
<a href={{link_to_static_file("95d1434-0b11-4900-81fb-5f0d299fd03c")}}>
    <div><span class="fa fa-download">Click here to download your file!</div>
</a>
link_to_static_file_by_name
Creates an URL pointing to a file to download, from the name of the file. The goal of this function is to let you build dynamically the name of the file to download, using logger users' metadata or dashboards' variables.
Parameters:
filename: name of the static file to download.
Example:
<a href={{link_to_static_file_by_name($$login.business_unit$$ + "_" + varYear + "_sales.xlsx")}}>
    <div><span class="fa fa-download">Click here to download your XLSX file!</div>
</a>
where varYear is a dashboard's variable.
today
Returns the date of the current day (default format is YYYY/MM/DD).
Parameters:
format(default:yyyy/MM/dd): output format (see https://date-fns.org/v2.29.3/docs/format) for options.language:en(default) orfr
Example:
today('yyyy/MM/dd', 'en')
year
Returns the current year (or a previous/following year).
Parameters:
delta_years(default: 0): number of years to add to the current year (or to remove if negative).
Example:
year() // current year
year(-1) // previous year